Recent trends in VMT and gasoline consumption
Summary
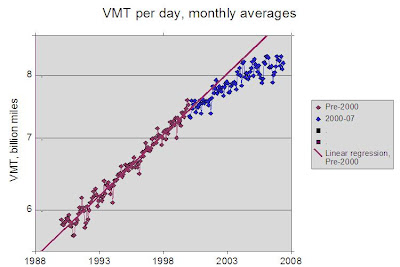
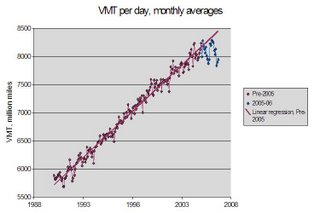
Analysis of travel data compiled the Federal Highway Administration (FHWA) indicates that national aggregate vehicle miles traveled (VMT) for auto-type vehicles grew at an annual rate of 2.57% in the interval 1990-99. This high rate seems unlikely, considering that U.S. population has recently been growing at just 1.1% per year (U.S. census data). Furthermore, the reported VMT data series is exceedingly "smooth," indicating generation by a model rather than determination from direct measurement of actual traffic volume. According to the FHWA, the rate of growth in VMT since 2000 has decreased to 1.67% per year, with very little growth since 2004.
A check on VMT data reported by the FHWA is fuel consumption data from other sources. In particular, gasoline consumption should closely track automobile VMT, since gasoline is specifically tailored to powering automobiles and has almost no other use. The Energy Information Administration (EIA) reports production/consumption of all principal petroleum products, including gasoline. According to the EIA, gasoline consumption was growing at an annual rate of 1.88% in the period 1990-99, significantly lower than the VMT rate of growth reported by the FHWA. The difference in growth rates is apparent in miles per gallon (mpg), computed by division of VMT by gasoline consumption. According to this calculation, fleet fuel efficiency (for auto-type vehicles) grew from 17.9 mpg in 1990 to 19.4 in 2000 -- an 8% increase reflecting the difference in the growth rates of VMT and gasoline consumption. Such a rapid increase in fleet mpg is NOT supported by direct measurement of fleet fuel economy.
My motivation for looking at the gasoline and VMT data was an interest in whether gasoline consumption is a good proxy for auto VMT.
My principal questions are:
Automobile VMT
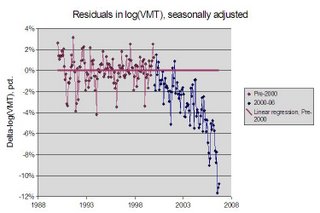
Analysis of travel data compiled the Federal Highway Administration (FHWA) indicates that national aggregate vehicle miles traveled (VMT) grew at an annual rate of 2.61% in the interval 1990-99, while auto VMT (excluding heavy trucks and buses, but including SUVs and light trucks) grew at a slightly lower rate of 2.57%. Since the beginning of 2000 the growth of auto VMT has dropped significantly, to an annual rate of 1.67% (2000-06). The high rate (particularly prior to 2000) is suspicious, since U.S. population has been growing at a rate of only 1.1% in recent years (U.S. census data). Furthermore, the reported VMT data series is exceedingly "smooth", with very little scatter from a secular growth combined with a very repeatable annual variation. It appears that the VMT data are heavily modelled, with only occasional corrections using a relatively small number of spot traffic counts.
 Figure 1. Auto VMT (miles/day, monthly averages), adjusted for truck and bus travel, plotted on a logarithmic scale. 1990-99 data and trend are given by burgundy points and line; 2000-07 data by blue points and line; truck and bus travel by black line, multiplied by a factor of 10.
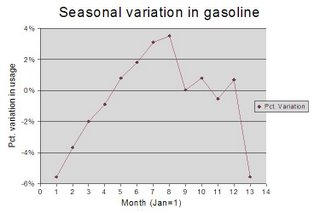
 Figue 2. Residuals of VMT data shown in Fig. 1, from a staight line fit to ln(VMT) in the interval 1990-99. Fit data are given by burgundy points; 2000-07 data by blue points. Upper black line indicates summer trend (local average of June, July and Aug. data), while lower black line indicates winter trend (local average of Dec., Jan. and Feb. data).
Gasoline consumption
the Energy Information Administration (EIA) is an independent source of ostensiably the same data. What is puzzling is that the two data sets are not consistent, with EIA gasoline data consistently lower than FHWA data by about 3% in the decade 1990-99.
The FHWA reports gasoline production and consumption (mainly to monitor motor fuel taxes), but
(gasoline related products, such as gasohol, are combined in the report).
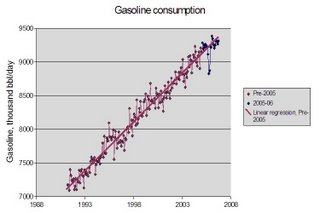
 Fig. 3.
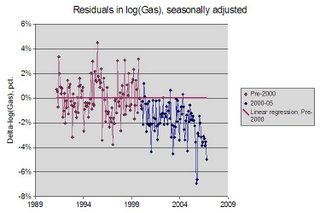
 Fig. 4.
 Fig. 5.
Analysis of travel data compiled the Federal Highway Administration (FHWA) indicates that national aggregate vehicle miles traveled (VMT) for auto-type vehicles grew at an annual rate of 2.57% in the interval 1990-99. This high rate seems unlikely, considering that U.S. population has recently been growing at just 1.1% per year (U.S. census data). Furthermore, the reported VMT data series is exceedingly "smooth," indicating generation by a model rather than determination from direct measurement of actual traffic volume. According to the FHWA, the rate of growth in VMT since 2000 has decreased to 1.67% per year, with very little growth since 2004.
A check on VMT data reported by the FHWA is fuel consumption data from other sources. In particular, gasoline consumption should closely track automobile VMT, since gasoline is specifically tailored to powering automobiles and has almost no other use. The Energy Information Administration (EIA) reports production/consumption of all principal petroleum products, including gasoline. According to the EIA, gasoline consumption was growing at an annual rate of 1.88% in the period 1990-99, significantly lower than the VMT rate of growth reported by the FHWA. The difference in growth rates is apparent in miles per gallon (mpg), computed by division of VMT by gasoline consumption. According to this calculation, fleet fuel efficiency (for auto-type vehicles) grew from 17.9 mpg in 1990 to 19.4 in 2000 -- an 8% increase reflecting the difference in the growth rates of VMT and gasoline consumption. Such a rapid increase in fleet mpg is NOT supported by direct measurement of fleet fuel economy.
My motivation for looking at the gasoline and VMT data was an interest in whether gasoline consumption is a good proxy for auto VMT.
My principal questions are:
- To what extent is gasoline consumption a good proxy for auto VMT?
- To what extent has higher gasoline prices affected consumption and VMT?
Automobile VMT
Analysis of travel data compiled the Federal Highway Administration (FHWA) indicates that national aggregate vehicle miles traveled (VMT) grew at an annual rate of 2.61% in the interval 1990-99, while auto VMT (excluding heavy trucks and buses, but including SUVs and light trucks) grew at a slightly lower rate of 2.57%. Since the beginning of 2000 the growth of auto VMT has dropped significantly, to an annual rate of 1.67% (2000-06). The high rate (particularly prior to 2000) is suspicious, since U.S. population has been growing at a rate of only 1.1% in recent years (U.S. census data). Furthermore, the reported VMT data series is exceedingly "smooth", with very little scatter from a secular growth combined with a very repeatable annual variation. It appears that the VMT data are heavily modelled, with only occasional corrections using a relatively small number of spot traffic counts.
 Figure 1. Auto VMT (miles/day, monthly averages), adjusted for truck and bus travel, plotted on a logarithmic scale. 1990-99 data and trend are given by burgundy points and line; 2000-07 data by blue points and line; truck and bus travel by black line, multiplied by a factor of 10.
 Figue 2. Residuals of VMT data shown in Fig. 1, from a staight line fit to ln(VMT) in the interval 1990-99. Fit data are given by burgundy points; 2000-07 data by blue points. Upper black line indicates summer trend (local average of June, July and Aug. data), while lower black line indicates winter trend (local average of Dec., Jan. and Feb. data).
Gasoline consumption
the Energy Information Administration (EIA) is an independent source of ostensiably the same data. What is puzzling is that the two data sets are not consistent, with EIA gasoline data consistently lower than FHWA data by about 3% in the decade 1990-99.
The FHWA reports gasoline production and consumption (mainly to monitor motor fuel taxes), but
(gasoline related products, such as gasohol, are combined in the report).
 Fig. 3.
 Fig. 4.
 Fig. 5.
