Recent trend in aggregate VMT
Based on FHWA (Federal Highway Administration) data, U.S. aggregate VTM (vehicle miles traveled) was increasing at a steady 2.6% per year from 1988 to mid-2000. Since mid-2000, however, there has been a noticable slowdown in the increase, and for the last two years, almost no increase at all, as can be seen in the following figure:
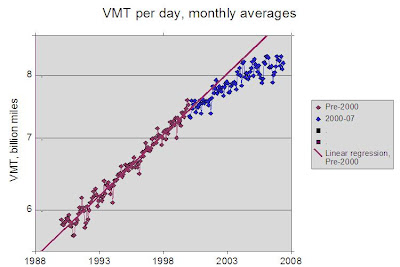 Note that VMT is plotted on a log scale, and has been adjusted for the average seasonal variation in the years 1988-2005 (see earlier post in my blog). A plot of the residuals from a linear regression is prehaps more impressive:
 For the first five months of 2007, aggregate VMT is down nearly 10% from the trend established pre-2000. Furthermore, summer travel last year was down significantly compared to winter travel (at least 3%).
What is the reason for this decrease in travel? The most obvious reason is the steadily increasing price of gasoline, and this expanation is supported by the recent decrease in summer (discretionary) travel. But this may not be all of the story. Vehicular travel in the U.S. has reached an incredible 8 billion miles per day -- about 33 miles per day per adult, and perhaps 40 miles per day per active driver. It's difficult to see how these averages can increase much further, so driving may simply have finally reached saturation.
Finally, there seems to be little public acknowledge of the downturn in VMT, and transportation planners are still projecting increases in travel based on the pre-2000 trends.
-- Jed
posted by Water Study Group at 10:47 PM
![]()

0 Comments:
Post a Comment
<< Home