VMT and Gasoline trends
Two issues to be addressed:
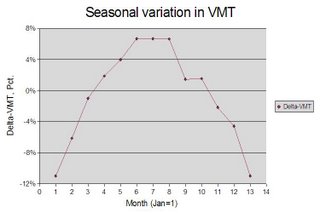
The two major variations in the VMT time series are
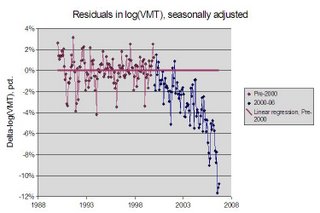
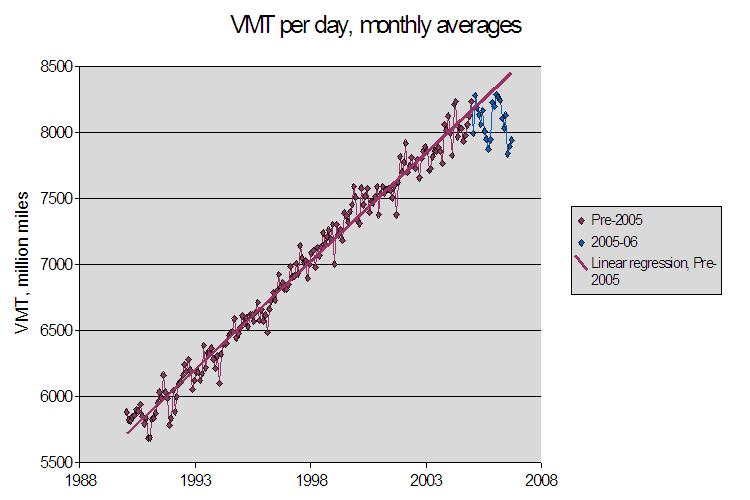
Log VMT is then seasonally corrected using this curve, and converted back to VMT by applying exp:

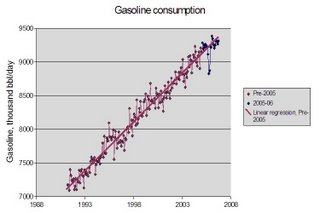
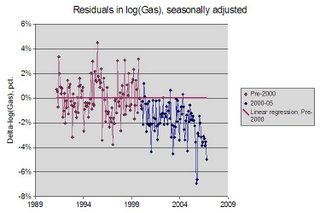
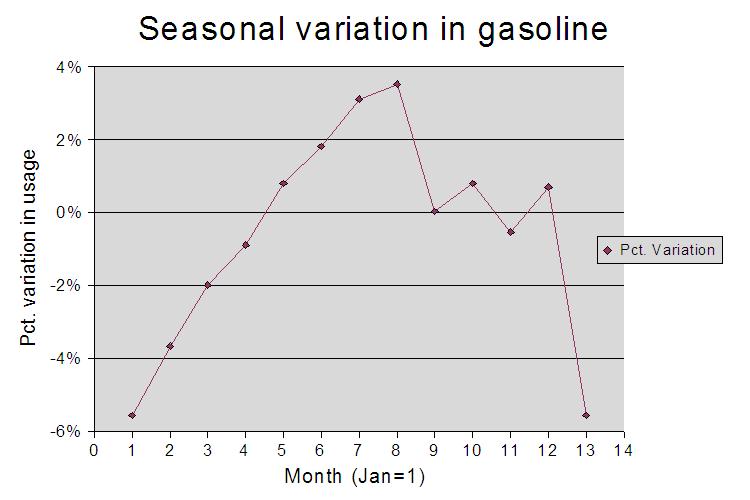
- How are VMT (and gasoline consumption) reacting to high petroleum prices?
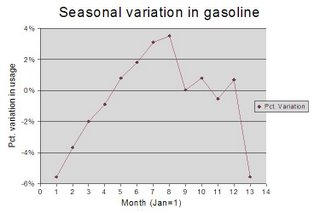
- Is gasoline consumption a good proxy for VMT?
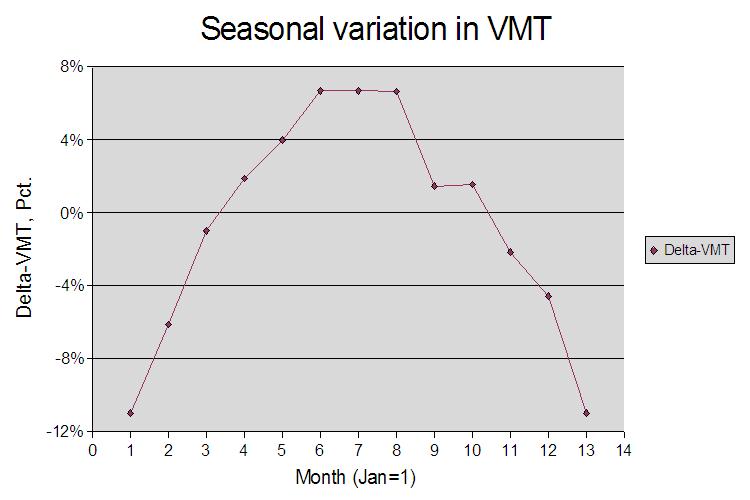
The two major variations in the VMT time series are
- A long-term secular increase,
- An annual variation with maximum in summer, minimum in winter, and an amplitude of nearly 20%.
Log VMT is then seasonally corrected using this curve, and converted back to VMT by applying exp:


posted by Water Study Group at 4:38 PM
0 comments
![]()
